
Page 16 - ELG1810 Oct Issue 461
P. 16
SUPPLEMENT .
Canada can, can you?
At-risk children do well in Canadian bilingual programmes
– but can other countries replicate their results? Melanie Butler investigates.
chools reproduce inequalities’ – or so argued French counterparts in monolingual classes. The same is true of the biggest
sociologist Jean Bourdieu. In bilingual programmes, there group of third-language speakers: migrant children.
are three groups of children who are particularly at risk. And a 2015 report from the government of Ontario province
‘SThere are those from families with low socio-economic found that, with the proper teaching strategy and learner support,
status (SES), those with specific learning difficulties related to most children with special education needs can do well in
language processing, and those who speak a third language at home. immersion. For how teachers can identify such children and they
When we think of children who speak a third language, we think can support them, turn to the article by Judit Kormit on page 17.
of migrants. On average, 24 per cent of the school population in The Canadian report warns, however that such support is often
OECD member countries come from migrant backgrounds. not available. And that only half as many children with special
But they are not the only ones with a different home language. In needs are enrolled in bilingual programmes as in monolingual ones.
Spain, children who speak one national language, like Castilian, may In any case, relying on data from Canada is dangerous, judging
be in schools that use another official language, such as Valencian. by its results in the OECD Pisa tests, Canada simply has better
And then we have dialects. In Italy, an estimated 50 per cent of educational outcomes than most other countries, especially for at-
children speak variants of Italian or unrelated ‘dialects’ including risk children.
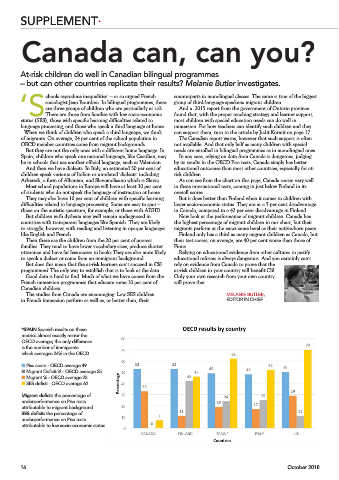
Arbëresh, a form of Albanian, and Slavomolisano which is Slavic. As can see from the chart on this page, Canada scores very well
Most school populations in Europe will have at least 30 per cent in these international tests, coming in just below Finland in its
of students who do not speak the language of instruction at home. overall scores.
They may also have 10 per cent of children with specific learning But it does better than Finland when it comes to children with
difficulties related to language processing. Some are easy to spot – lower socio-economic status. They are at a 7 per cent disadvantage
those on the autistic spectrum, for example, or those with ADHD. in Canada, compared to a 42 per cent disadvantage in Finland.
But children with dyslexia may well remain undiagnosed in Now look at the performance of migrant children. Canada has
countries with transparent languages like Spanish. They are likely the highest percentage of migrant children in our chart, but their
to struggle, however, with reading and listening in opaque languages migrants perform at the exact same level as their native-born peers.
like English and French. Finland only has a third as many migrant children as Canada, but
Then there are the children from the 20 per cent of poorest their test scores, on average, are 40 per cent worse than those of
families. They tend to have lower vocabulary sizes, produce shorter Finns.
utterance and have far less access to books They are also more likely Relying on educational evidence from other cultures to justify
to speak a dialect or come from an immigrant background. educational reforms is always dangerous. And you certainly can’t
But does this mean that the at-risk learners can’t succeed in Clil rely on evidence from Canada to prove that the
programmes? The only way to establish that is to look at the data. at-risk children in your country will benefit Clil.
Good data is hard to find. Much of what we have comes from the Only your own research from your own country
French immersion programmes that educate some 10 per cent of will prove that.
Canadian children.
The studies from Canada are encouraging. Low SES children MELANIE BUTLER,
in French immersion perform as well as, or better than, their EDITOR IN CHIEF
*SPAIN Spanish results on these
metrics almost exactly mirror the
OECD average; the only difference
is the number of immigrants
which averages 24% in the OECD.
■ Pisa score - OECD average 49
■ Migrant Defi cit % - OECD average 25
■ Migrant % - OECD average 23
■ SES defi cit - OECD average 62
Migrant defi cit: the percentage of
underperformance on Pisa tests
attributable to migrant background
SES defi cit: the percentage of
underperformance on Pisa tests
attributable to low socio-economic status
16 October 2018