
Page 8 - ELG1702 Feb Issue 444
P. 8
Page 8 ELdata February 2017
nesco has updated its data on global Following global flows Importers and
flows of students in tertiary educa-
Ution. Some of the most recent figures exporters
from their dataset are from 2015, while If international students
others are from 2014. Below we analyse can be considered a
the main source countries (where students Claudia Civinini analyses the recently released Unesco commodity, then there
come from) and destination countries (where are exporters and
they’re going), and then look at some spe- figures on international tertiary-level mobile students importers. Analysing
cific markets. n the net flow of students
– the number of incom-
Main destination countries Main source countries ing students minus the
number of outgoing stu-
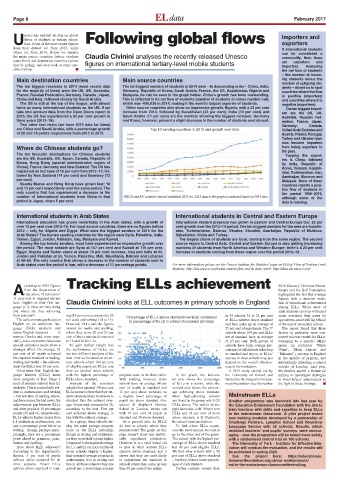
The ten biggest receivers in 2014 (most recent data The ten biggest senders of students in 2014 were – in descending order – China, India, dents – allows us to spot
for the majority of them) were the US, UK, Australia, Germany, Republic of Korea, Saudi Arabia, France, the US, Kazakhstan, Nigeria and countries where the flow
France, Russian Federation, Germany, Canada , Japan, Malaysia. As can be seen in the graph below, China’s growth has been outstanding. is positive (importers)
China and Italy, followed closely by Saudi Arabia. This is reflected in its net flow of students (number of students in minus number out), and countries where it is
The US is still at the top of the league, with almost which was -650,036 in 2014, making it the world’s largest exporter of students. negative (exporters).
twice as many international students as the UK. If we Other source countries also show an impressive growth. Nigeria, with a 23 per cent The ten biggest import-
take into account data from the Open Doors report in increase from 2013, followed by Kazakhstan (23 per cent), India (12 per cent) and ers are the US, UK,
2016, the US has experienced a 33 per cent growth in Saudi Arabia (11 per cent) are the markets showing the biggest increase. Germany Australia, Russian Fed-
three years (2013–16). and Korea, however, present a slight decrease in the number of students sent abroad. eration, France, Japan,
Two other fast risers (we have 2015 data for them) Germany, Canada,
are China and Saudi Arabia, with a percentage growth Top 10 sending countries in 2015 and growth over time United Arab Emirates and
of 28 and 18 points respectively from 2013 to 2015. Austria. Poland, Portugal,
Turkey and Ukraine have
now become importers
Where do Chinese students go? from being exporters in
the past.
The ten favourite destinations for Chinese students Topping the export-
are the US, Australia, UK, Japan, Canada, Republic of ers is China, followed
Korea, Hong Kong (special administrative region of by India, Republic of
China), France, Germany and New Zealand. The US has Korea, Vietnam, Kazakh-
registered an increase of 16 per cent from 2013–14, fol- stan, Turkmenistan, Iran,
lowed by New Zealand (14 per cent) and Germany (13 Azerbaijan, Morocco and
per cent). Malaysia. None of these
Nearby Macao and Hong Kong have grown fast: 18 countries reports a posi-
and 13 per cent respectively over the same period. The tive flow of students in
only country that has experienced a decrease in the the period 1999–2015,
number of international students from China in that OECD and EU countries haven’t submitted 2015 yet. 2015 data in the graph is estimated based on 2014 data although some of the
period is Japan, down 5 per cent. data is missing.
International students in Arab States International students in Central and Eastern Europe
International education has grown remarkably in the Arab states, with a growth of International student presence has grown in Eastern and Central Europe too: 23 per
over 15 per cent over 2012–15. For most source countries, there are no figures before cent growth over the 2012–14 period. The ten biggest senders for the area are Kazakh-
2012 – only for Algeria and Egypt. What were the biggest senders in 2015 for the stan, Turkmenistan, Belarus, Ukraine, Slovakia, Azerbaijan, Republic of Moldova,
Arab States? The top ten sending countries for the region were Syria, Palestine, India, Uzbekistan, China and Turkey.
Yemen, Egypt, Jordan, Pakistan, Iraq, Malaysia and Kuwait. The largest chunk of students are local, coming from the same region. The second
Among the top twenty senders, most have experienced an impressive growth over source region is Central Asia. Central and Eastern Europe is also getting increasing
the period. The most notable are Syria at 157 per cent and Kuwait at 116 per cent. numbers of students from North America and Western Europe: there’s a 23 per cent
Egypt, Nigeria and Sudan stand at about 70 per cent increase, Iraq and India at 65, increase in students coming from these region over the period 2012–14.
Jordan and Pakistan at 55, Yemen, Palestine, Mali, Mauritania, Bahrain and Lebanon
at 40–50. The only country that shows a decrease in the number of students sent to
Arab states over the period is Iran, with a decrease of 17 percentage points. For more information, please see the Unesco Institute for Statistics’ page on Global Flow of Tertiary-Level
Students: http://uis.unesco.org/en/uis-student-flow and its data centre: http://data.uis.unesco.org/
Tracking ELLs achievement
ccording to 2016 figures 2016 Gazette), Unbound Philan-
from the Department of thropy and the Bell Foundation
AEducation, 18 per cent of highlighted the fact that average
11 year-olds in England did not figures hide a massive varia-
have English as their first lan- Claudia Civinini looks at ELL outcomes in primary schools in England tion of educational achievement
guage (L1). How are they doing among ELLs. While most of
and where are they achieving such students catch up with (and
their potential? ing (14 per cent as opposed to 20 Percentage of ELLs above standard (vertical) compared in 45 schools 35 to 52 per cent some overtake) their peers by
The achievement gap between per cent) and writing (14 to 15). of ELLs achieve above standard age sixteen, some still lag behind
English as an additional lan- However, ELLs turn the figures to percentage of ELLS in school (horizonal) (all data) and they make up an average of at the end of secondary school.
guage (EAL) speakers and around for maths and spelling, 25 per cent of enrolments. The 77 The report found that three
native-English-speakers is where they score 20 and 25 per schools where 100 per cent ELLs factors in particular were con-
narrow. Gender and, more espe- cent of above standard compared are at standard have an average nected to lower results for ELLs:
cially, socio-economic status and to 16 and 20 for L1s. of 23 per cent. Both groups of belonging to a specific ethnic
special education needs show a To gain further insight into schools have high average per- group (in particular ‘White
stronger effect. On average, 53 the performance of ELLs, we centages of all students achieving Other’, ‘Black African’ and
per cent of all pupils achieved ran two different analyses of the to standard and above, so ELLs’ ‘Pakistani’), arriving in England
the required standard in reading, data. First we focussed on seven- success in these schools may just in the middle of primary, and
writing and maths – the achieve- teen schools where 100 per cent depend on the overall effective- interestingly attending a school
ment for EALs was 50 per cent. of eligible pupils are ELLs, and ness of the institution. outside of London. Last year,
Good news first: English lan- then we tracked down schools A 2015 study carried out by the funders agreed a further £2
guage learners (ELLs) make with the highest percentage of progress score in the three skills. In the graph, the horizon- the University of Oxford and million to investigate strategies
more progress at Key Stage 2 ELLs above standard. With reading, however, these tal axis shows the percentage funded by the Education Endow- to boost EALs’ achievement in
(end of primary school) than L1 Analysis of the seventeen schools have on average 64 per of ELLs in a school, while the ment Foundation (see November the light of these findings. n
students. This is particularly evi- schools that reported 100 per cent cent of pupils at standard and vertical axis shows the percent-
dent in mathematics and writing ELLs seems to show that their stu- 12 per cent above standard, so age achieving above standard.
– but less true of reading where, dents are more likely to achieve to a slightly lower percentage of Most high-achieving schools Mainstream ELLs
and here comes the bad news, the standard than the national aver- pupils are above standard. One are found in the group with 0-20 Another programme was launched late last year by
achievement gap between ELLs age: 56 per cent, compared to 50, school, St Stephen’s Primary ELLs above. The outlier on the the Education Endowment Foundation with the aim to
and other pupils is 10 percentage according to the data. Five per School in London, stands out right hand side, with 100 per cent train teachers with skills and expertise to keep ELLs
points (58 and 68, respectively). cent achieved above average, in with 93 per cent of pupils at ELLs and 38 per cent of them in the mainstream classroom. A pilot project tested
ELLs achieve higher scores than line with the national average. standard and 38 above standard. above standard, is St Stephen’s, new training modules developed by a partnership of
L1 students in mathematics, are As a group, these schools dis- As a general rule, do ELLS the school mentioned above. Challenge Partners, Lampton School and Hounslow
just a percentage point below in play the same average progress do best in schools where they To find where ELLs experi- Language Service with 58 schools. Results, which
writing – though, perhaps unsur- score as for ELLs nationally, predominate? The graph on this ence the most success, we need to included teachers’ and pupils’ surveys, were encour-
prisingly, they are a percentage though in writing and mathemat- page doesn’t show any statisti- go to the other end of the graph. aging – now the programme will be tested more widely
point ahead in grammar, punc- ics they score half a point higher. cally significant correlation. The school with the highest per- with a randomised control trial on 100 schools.
tuation and spelling. Compared to the national average However, it is a valid visual aid centage of ELLs above standard The University of York – Institute for Effective Edu-
How about high achievers? for L1 and L2 (or Lx) combined, to spot in what context ELLs has 40 per cent eligible ELLs. cation will conduct the evaluation, and the results will
According to the department’s seven schools display a higher- achieve above standard, and it We find other schools with a 50 be published in spring 2020.
figures, 5 per cent of pupils than-national-average progress in shows that they are most likely per cent of ELLs above standard See the project here: https://educationen-
achieve above standard for all mathematics, five in writing and to outperform the standard in – but they all have lower percent- dowmentfoundation.org.uk/our-work/projects/
three subjects. Fewer ELLs two in all three subject. Only one schools where they make up less ages of such students. eal-in-the-mainstream-classroom/#recruiting
achieve above standard in read- school has a lower-than-average than 50 per cent of the intake. Further analysis reveals that,
p08-09_ELG0217.indd 1 2/6/2017 4:27:20 PM